
What Is a Good ROAS? Why the Number Alone Won’t Tell You If Your Ads Are Profitable
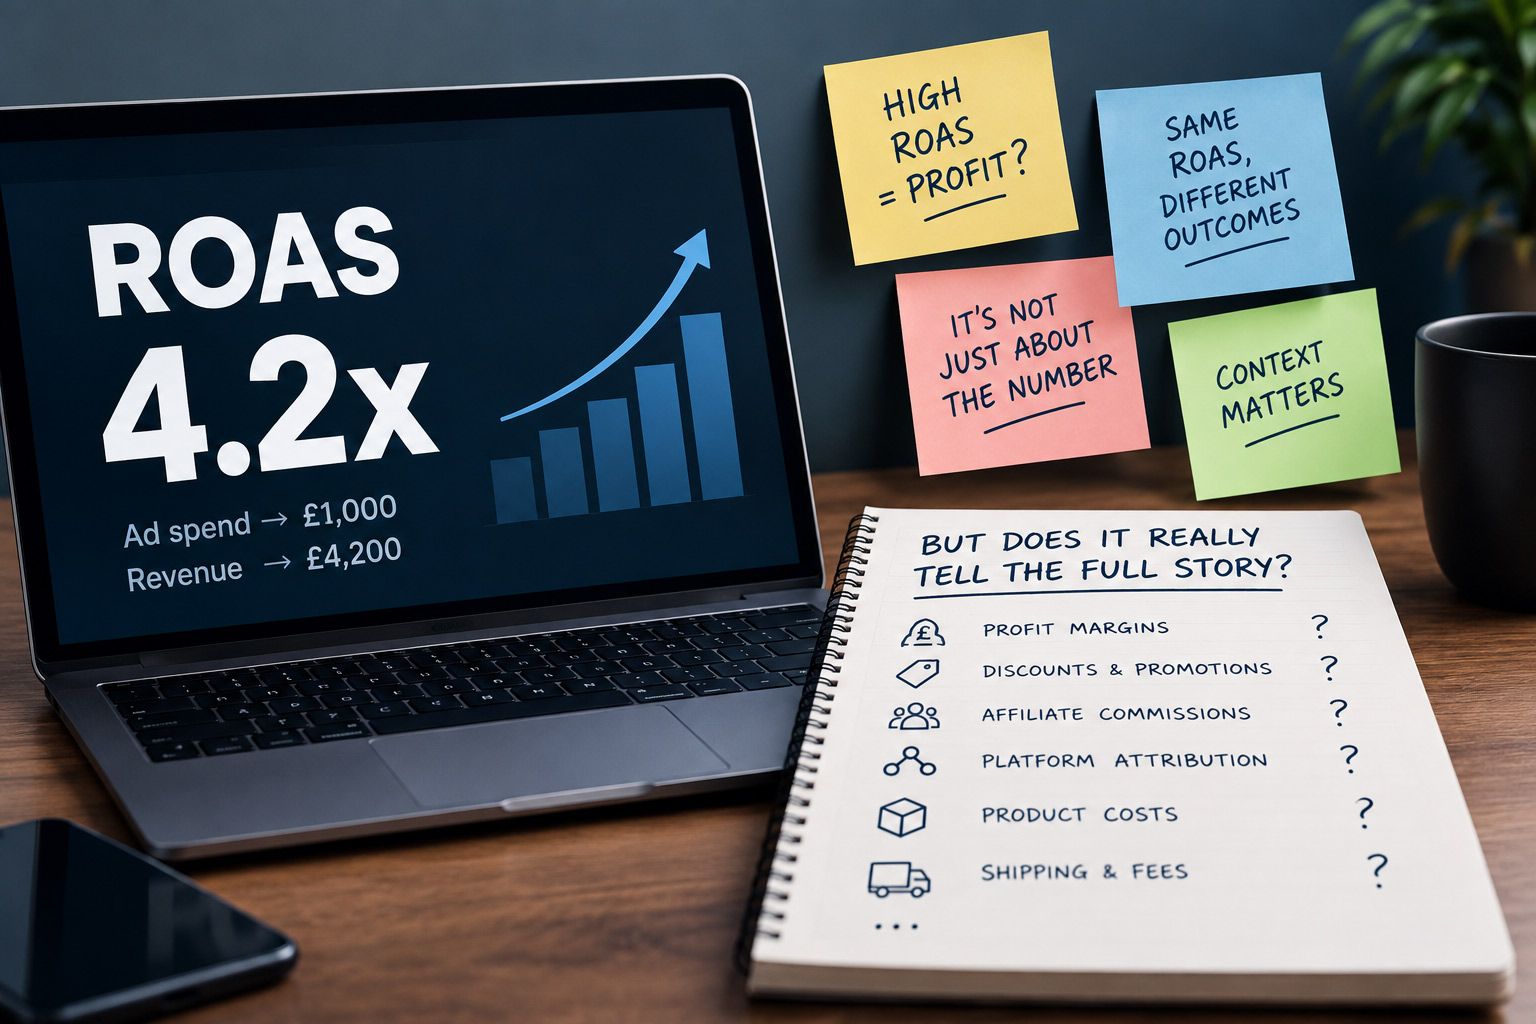
ROAS (return on ad spend) is revenue divided by ad spend. If you were to spend £1,000, make £4,000 back, and your ROAS is 4x, or 400%. It is one of the first numbers that a lot of ecommerce owners and managers look for when assessing whether their digital advertising is working.
The problem with ROAS, is that this single metric tells you almost nothing about whether you’re actually making money.
A 4x ROAS can be excellent for one brand and quietly losing money for another, even if it’s sold on the same site, in the same week, through the same ad account. When you factor in your margin, your discounting, your affiliate commission and the way each platform counts a sale, these all sit underneath that final ROAS number and pull it in different directions.
So ROAS is worth watching? In my opinion as from 16 years in the ecommerce game, it’s a grey area to judge success on by itself, although still a very important metric to assess. Below is what it really measures, how to work it out and what it leaves out. Also, why the reduced-price bestseller showing a “great” ROAS might be the sale costing you more than the others.
In This Article
- What is ROAS, and how do you calculate it?
- What counts as a good ROAS in ecommerce?
- Why your account ROAS hides more than it shows
- Why margin decides whether a ROAS is any good
- Why sales and discounts flatter your ROAS
- Why your platforms never agree on ROAS
- What ROAS won’t tell you
- So should you ignore ROAS?
- FAQ
What Is ROAS, And How Do You Calculate It?
ROAS is the revenue generated for every £1 you spend on advertising. The formula is simple:
- ROAS = revenue from ads ÷ cost of ads
As I mentioned in the intro, if a campaign spends £2,000 and drives £8,000 in tracked sales, that’s a 4x ROAS (or 400%). This metric is reported at every level (and if it’s not, you can ususally customise reports to show it):
- per keyword
- per campaign
- per channel
- blended across the whole account.
There’s 2 things that can cause issues immediately if you don’t understand what it is and what it isn’t.
First, ROAS is not ROI. ROAS is built on revenue, which is the money that lands in the basket. ROI (or profit) is what’s left after you’ve paid for the product, the shipping, the payment fees and everything else. Therefore you can show a healthy ROAS but still lose money on the sale at the end of the day. More on that shortly.
Secondly, “revenue from ads” can sometimes be used very loosely within that formula. This is because every platform decides for itself which sales its ads deserve credit for, and they don’t agree with each other or with your Shopify dashboard. That’s a whole section on its own further down in the article.
What Counts As A Good ROAS In Ecommerce?
The honest answer to this, is whatever clears your break-even with room to spare. The commonly quoted rule of thumb is 3x to 4x, and aggregated benchmark data tends to put the 2026 ecommerce average somewhere around 2.9x, with the median closer to 2x. Google Ads usually reports higher than Meta, which reports higher than TikTok, mostly because search catches people who already want to buy.
A 4x ROAS is printing money for a brand on 65% margins and could be losing money for a brand on 25% margins, and both of those brands might be sitting in the same benchmark report.
The only benchmark that matters is your own break-even ROAS, and it’s easy to work out:
- Break-even ROAS = 1 ÷ gross margin
Anything above that line is profit at the product level. Anything below it means you’re spending £1 to make less than £1 back. Here’s what break-even looks like across common margins:
| Gross margin | Break-even ROAS | What that means |
|---|---|---|
| 20% | 5.0x | You need 5x just to stand still |
| 30% | 3.3x | A “good” 3x is still underwater |
| 40% | 2.5x | 2.5x is your floor, not your win |
| 50% | 2.0x | Everything over 2x is profit |
| 60% | 1.7x | Low returns can still pay |
| 70% | 1.4x | You’ve got real room to scale |
Read your margin off that table and you’ve got a number that means something whereas the industry average doesn’t.
Why Your Account ROAS Hides More Than It Shows
This is where the trouble really starts, and it’s easiest to see with a designer clothing example, because I run these accounts for a living.
Picture in your mind a multi-brand menswear retailer. Split the ad account into brand groups. Group A is new-season sportswear: Adidas, Nike, New Balance. Three huge names, so the business backs them hard with a £10,000 budget. They run at a 2x ROAS. Doubling your money sounds fine until you remember two things: 2x is weak against any sensible benchmark, and sportswear carries thin markup, so you are fighting for margin before you spent a penny on ads.
Group B is premium tailoring and casualwear: BOSS, Paul Smith, Sandbanks. They have a better markup, so there is more money on the table per sale. You put a smaller £2,000 budget behind them and they return 6x. Now that’s a good ROAS.
Look at the example below to see what happens when you roll them together:
| Brand group | Ad spend | Revenue | ROAS |
|---|---|---|---|
| Group A (sportswear) | £10,000 | £20,000 | 2x |
| Group B (premium) | £2,000 | £12,000 | 6x |
| Simple average of the two figures | n/a | n/a | 4x |
| Whole account (weighted by spend) | £12,000 | £32,000 | 2.67x |
Glance at the two campaigns and it’s tempting to say “2x and 6x, so we’re averaging 4x, happy days”. But that 4x is a lie you tell yourself. It treats a £10,000 campaign and a £2,000 campaign as equals, and they’re nowhere near equal. The real blended ROAS is total revenue over total spend: £32,000 ÷ £12,000 = 2.67x. The bulk of the budget sat on the weak performer, so the honest account number is dragged right down towards it.
Even worse still, once you bring margin back in (next section), that £10,000 on Group A may have been losing money at the product level the whole time, while the small, ignored £2,000 on Group B was the real engine. One blended number would never have told you that.
The takeaway: never judge an account on one blended ROAS. Break it down by brand, category or campaign, weight it by spend, and look at where the money actually is. Averages hide your best and worst performers in the same breath.
Why Margin Decides Whether A ROAS Is Any Good
Go back to the break-even table and lay it over those two brand groups.
Sportswear tends to run on thin margins, say 30% to 40%. That puts break-even at roughly 2.5x to 3.3x. So Group A’s “doubling your money” 2x ROAS isn’t a modest win. It is in fact a below break-even. Every one of those £10,000 was buying sales that lost money before overheads.
Premium brands can often sit at 55% to 65% margin, so break-even lands nearer 1.5x to 1.8x. Group B’s 6x ROAS is miles clear of that. It’s not just good, this is the kind of return you build a scaling plan around.
It’s the same account and same reporting, but two completely different economic realities. The number that looked worse (2x) is the loss-maker, and the number that looked good (6x) is the one you should be feeding.
Why Sales And Discounts Flatter Your ROAS
Here’s the trap that catches even experienced advertisers. Take those same sportswear brands from Group A and this time put them in the sale at 30% off. Call it Group C.
Your ROAS jumps, and it jumps for a boring reason: people love a bargain, so more of them convert. Revenue climbs. Google sees a campaign suddenly performing and starts nudging you to spend more, because more spend at a higher return is exactly what its bidding wants. On the dashboard, everything looks brilliant.
Now count what’s actually left in the till:
- You gave away 30% of the price before a single ad ran, so your margin was cut before the campaign even started.
- If the shopper came through a cashback or discount affiliate (TopCashback, Quidco, a voucher site), you pay commission on top, another slice gone.
- If they took your “15% off your first order” newsletter code as well, there goes another chunk.
Stack those together and a sale showing a lovely 5x or 6x ROAS can carry barely any profit, or none. The ROAS looks better precisely because the sale is worth less. Revenue up, margin down, and a headline metric cheerfully telling you to pour more budget into the leakiest part of the account.
This is the single most common way I see fashion retailers fool themselves. Discount-driven ROAS is the easiest ROAS to grow and the most expensive to trust.
Why Your Platforms Never Agree On ROAS
Even if you nail margin and discounting, there’s one more problem: the revenue half of the formula is contested. Meta, Google and your Shopify reports will all quote you a different ROAS for the same campaign, and they can’t all be right.
It comes down to attribution: which touchpoint gets the credit, and over what window. Meta and Google are what people call self-attributing networks. They sell you the ad space and mark their own homework, so they have every reason to claim as many sales as they can. Meta’s reported ROAS is commonly inflated by around 20% to 40%, largely through view-through conversions and generous windows. Google tends to over-report by roughly 15% to 20%, often by taking credit for branded searches from people who were always going to find you.
Attribution windows make it worse. A campaign measured on a 28-day window will always look better than the same campaign on a 7-day window, because the net is wider, not because the ads improved. And because neither platform deduplicates against the other, one customer who saw a Meta ad, then clicked a Google ad, then bought, gets counted by both. Add up everything your platforms claim and the total can reach 150% to 200% of the revenue that actually hit your bank account.
This shifted in 2026. In January, Meta removed its longer view-through windows, and in March it tightened what counts as a click. Reported ROAS dropped for a lot of advertisers overnight, even though their real sales didn’t budge. The upside is that Meta’s numbers now sit closer to what GA4 shows, but it caught plenty of people out who thought their ads had suddenly broken.
The practical fix is to stop treating any single platform’s ROAS as truth and add a channel-proof number alongside it: MER, or marketing efficiency ratio. That’s total revenue divided by total ad spend across everything. No platform can inflate it, because it doesn’t care who gets the credit. Use platform ROAS to optimise inside each platform, and use MER plus your actual Shopify or bank revenue to decide where the budget goes.
What ROAS Won’t Tell You
To pull it together, here’s everything a ROAS figure quietly leaves out:
- Profit. It’s built on revenue, not margin. A high ROAS on a low-margin, discounted product can still lose money.
- Incrementality. It won’t tell you whether the sale would have happened anyway. Branded search and retargeting both post strong ROAS partly by claiming customers who were already coming.
- Customer value over time. A 2x ROAS on a first order looks weak until that customer buys three more times. First-purchase ROAS and lifetime value are different questions.
- New versus returning. An account can hit its target ROAS entirely by remarketing to existing customers while acquiring almost nobody new. That’s a slow death dressed as success.
- The health of the whole account. One blended figure averages your winners and losers into a number that describes neither.
So Should You Ignore ROAS?
No. Some people online will tell you ROAS is the most pointless metric going and you should bin it entirely. That’s as daft as worshipping it. Ignore ROAS and you lose a fast, useful signal for how a specific campaign is trending day to day.
The sensible position is in the middle. ROAS is a gauge, not a verdict. Judge each campaign against its own break-even, not a generic benchmark. Break the account down by brand and category, weight it by spend, and look at where the money genuinely is. Then step back and judge the business on the things ROAS can’t see: profit after all costs, MER across every channel, new customer acquisition, and lifetime value.
Do that and ROAS becomes what it should be, one instrument on the dashboard rather than the whole cockpit. The retailers who scale profitably are the ones who read all the dials at once.
Frequently Asked Questions
What is a good ROAS for ecommerce?
There’s no universal figure. The rule of thumb is 3x to 4x, and the 2026 ecommerce average sits around 2.9x, but the only target that matters is your break-even ROAS, which is 1 divided by your gross margin. On a 50% margin that’s 2x, on a 30% margin it’s 3.3x. Anything above your break-even is profit; anything below it loses money.
How do you calculate ROAS?
Divide the revenue your ads generated by what you spent on those ads. Spend £1,000 and make £4,000 back and your ROAS is 4x, or 400%. Just remember that “revenue your ads generated” depends entirely on which platform is counting and over what attribution window.
What’s the difference between ROAS and profit?
ROAS measures revenue against ad spend. Profit measures what’s left after product cost, shipping, payment fees, discounts and overheads. You can post a strong ROAS and still make a loss, which is why margin has to sit next to ROAS in every decision. Some marketers now track POAS (profit on ad spend) to close that gap.
Why is my Meta ROAS higher than my Google or Shopify numbers?
Because Meta counts sales more generously. It uses view-through conversions and its own attribution windows, and it doesn’t deduplicate against other channels, so it’s commonly inflated by 20% to 40%. Google over-reports too, usually by 15% to 20% via branded search. Treat your Shopify or bank revenue as the source of truth and use MER (total revenue divided by total ad spend) to sanity-check the platforms.
Should I use ROAS or MER?
Both, for different jobs. Use ROAS to optimise inside a single platform, where its own attribution is at least consistent. Use MER to judge overall efficiency and decide budget across channels, because no platform can inflate a number based on your real total revenue.
Not sure if your ad spend is actually making money?
I’ve spent 15+ years running paid media and ecommerce for designer clothing retailers, from feed optimisation to first-page rankings. If your ROAS looks fine but the profit isn’t there, I can audit the account and tell you where the money’s really going.